
Here at Bad Movie Twins we love to make up rules about watching bad movies. The problem is the more rules we make up, the harder it is to find bad movies (poor Bad Movie Twins, our bad movie lives are so hard). That’s why we created the BMeTric. Who the hell are we to make up metrics for bad movies? It doesn’t matter! At this point we’ve put it in like a hundred previews so it is here to stay and at the very least needs to be explained. It does make us feel like we are winning the battle against the ever growing library of potential bad movies. Let’s go!
The Current Bad Movie Metric (aka The BMeTric)
In August of 2016 the OMDb API Monthly Data Dump became no more via, not surprisingly, a DMCA takedown order. Poor OMDb API Monthly Data Dump. Since then the BMeTric has become a bit … ahem, stale let’s say. So I got to work on version 2. Without a fast and reliable (not to mention strictly legal from the UK) way to connect IMDb profiles to Rotten Tomatoes pages it seemed like the perfect opportunity to address one of my major pet peeves about the metric: its reliance on knowing a large set of movies’ Rotten Tomatoes scores during calculation. After months of … neglect, I’ve finally done it and the new BMeTric is ready for the big reveal!
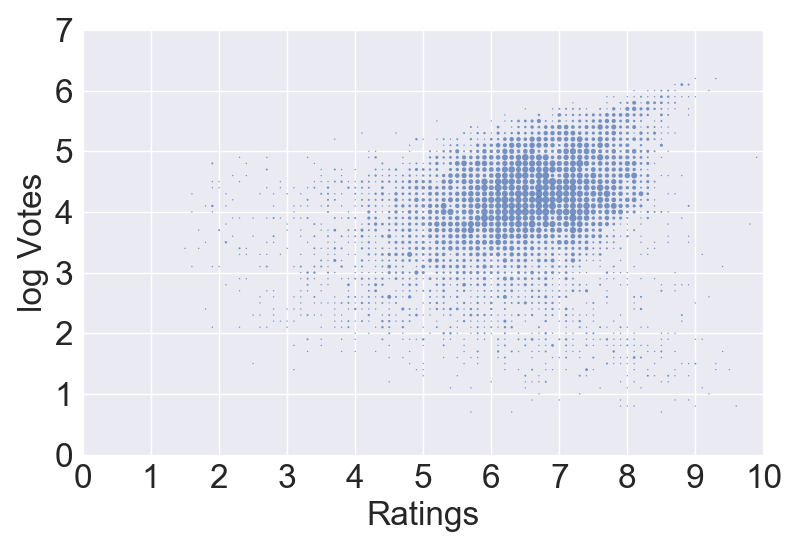
First, after much experimentation (uh … sorry IMDb) I’ve figured out a pretty reasonable way to get a large set of ten thousand (more actually, although ten thousand at the moment produces the best results) movies from IMDb. This set is roughly as you would expect given the original BMeTric:
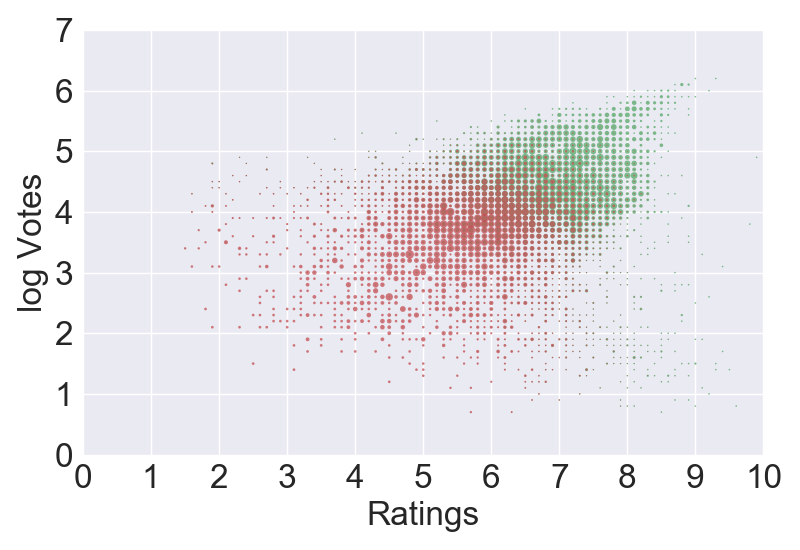
If you have very good eyes though you’ll notice that this is actually quite a different set of movies. Specifically it is missing a big chunk of “unpopular good films” (green are films in the old OMDb set but not in the new set weighted by frequency):

Well … screw them! Those are the opposite of BMT. The anti-BMT shall be shunned. But even though … you have to account for such things or else all of the BMeTrics will jump unnaturally. In particular the rating and the votes are both inflated by being the most popular IMDb has to offer. So what better than to weight everything such that you effectively are taking below-average ratings and votes into account. Effectively you take a 25% cut of the films to create the BMT (red is probability of bad and green is probability of good):
This is looking pretty good. Probably a mean bad movie of about 5.5 rating and like 5000 votes. Also the 25% number is pleasantly connected to our classic Rotten Tomatoes cutoff of 40%. It turns out that basically no matter what number of reviews you use as a threshold almost exactly 25% of films reviews on Rotten Tomatoes get below 40% good reviews. And, bonus, the BMeTric doesn’t move too much (around 5 on average, 10 at most):

Calculated in the same manner as below. Pleasing. Note that this changes the percentiles and whatnot a bit. The mean jumps from 25 to 30 for bad movies. All percentiles about the same. The top 20 is now:
- 95.9: Epic Movie (BMT)
- 95.6: Meet the Spartans (BMT)
- 95.1: Disaster Movie
- 94.3: Batman & Robin
- 94.2: Catwoman (BMT)
- 94.1: Battlefield Earth (BMT)
- 93.0: Dragonball Evolution (BMT)
- 92.0: Date Movie
- 91.7: Jack and Jill (BMT)
- 90.7: Son of the Mask
- 90.3: Fifty Shades of Grey (BMT)
- 89.9: Scary Movie 5 (BMT)
- 89.8: Speed 2: Cruise Control
- 89.6: Alone in the Dark (BMT)
- 88.4: The Hottie & the Nottie
- 88.0: Street Fighter
- 88.0: House of the Dead
- 87.6: Vampires Suck
- 87.5: Manos: The Hands of Fate (BMT)
- 87.3: The Last Airbender (BMT)
Exactly ten watched. This nicely illustrates probably the best part of the new metric, that is stretched everything out a bit. There are now eleven 90+ films with three 95+ films (thanks Friedberg and Seltzer!) whereas previously there was only size 90+ and the 20th film had a BMeTric of 81-ish. Something rather close to 100 should be possible (you just need a film to get a 2.0 with 200 thousand votes to get above 98 … maybe it isn’t possible). There are other pros and cons but … why not make a list:
Pros:
– The BMeTric is still unsupevised, has an intuitive meaning, is very fast to calculate.
– It now can be recalculated on demand. Indeed, one of the first projects I plan on setting out on is to see how it changes day to day (and let’s just say I already confirmed this, don’t really want the BMeTric moving around much)
– There is now a much more real possibility that you could back calculate the BMeTric using Internet Archive data. Which is exciting stuff.
– No more being tethered to Rotten Tomatoes! It is all from IMDb.
Cons
– It is still ever changing, which makes archive data still a little hard to interpret.
– The way you get from the “popularity” based distribution to the “bad movie” distribution is a bit ad hoc. I wish there was a more intuitive way to either filter it initially or transform the distribution.
– The ratings do jump more than I wish, which means eventually we’ll probably want to regenerate the existing plots.
– To the last point, it’ll probably help that no one read this blog. Zing (on me). Last time I said that in a few years we’d have something more sophisticated … naw, this is basically the same, but it has been a few years and we have a new metric. Hooray. Bring on the research.
The Original Bad Movie Metric (aka The BMeTric v1.0)
The BMeTric is calculated using the OMDb API monthly data dump (go to omdbapi.com, donate, and you too can get access). Taking only the movies with 10+ recorded rottentomatoes.com reviews and listed votes/ratings here is a plot representing all of the movies in this database (note that votes are on a log-10 scale):

Oooo, very nice. This though is a discrete (empirical) distribution, so we change it to an approximate version. It just makes things easier. Plus we like to think there is a finite probability that some movie that is yet to be made will be as popular as the Shawshank Redemption and as disliked as Going Overboard. A boy can dream, and an approximation assigns a non-zero probability to such an event. Alright, let’s split these up into good (Rotten Tomatoes scores at or above 40%, our traditional benchmark), and bad (below 40% on Rotten Tomatoes) movies:
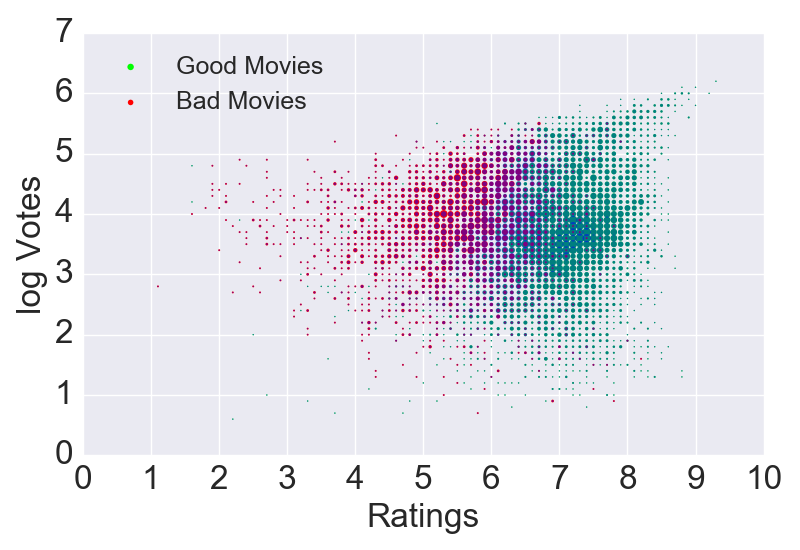
Already looking good. Good separation. The big test though is in the shape of the approximate underlying distribution. Let’s look at the marginal distributions of the ratings and log10(votes) for both good and bad movies:

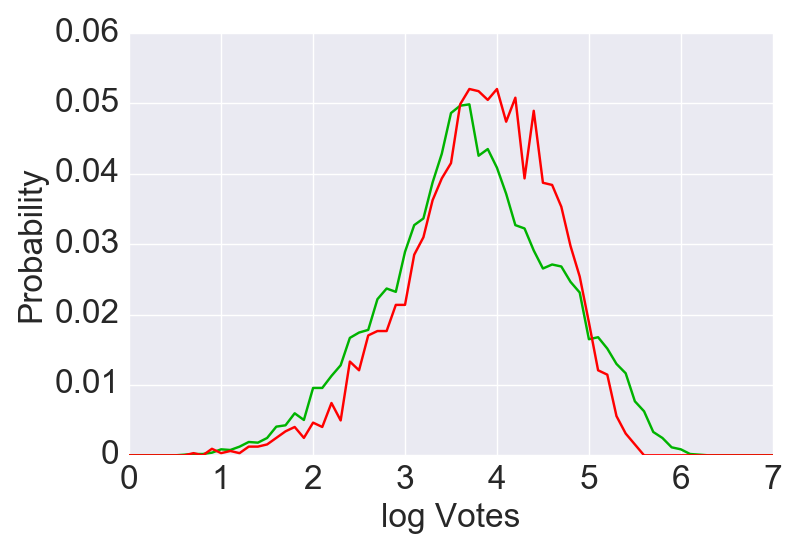
Two good things: First, the distributions (for both good and bad movies) are roughly bivariate normally distributed. At least, we’re not offended by the prospect of using such an approximation. Second, it is kind of amazing. Bad movies are, on average, one IMDb rating value lower than good movies. Shockingly, both appear to be just about equally popular judging by the number of votes. For shame movie fans. For shame.
Moving on, I simply fit a bivariate normal distribution to the bad movie data:

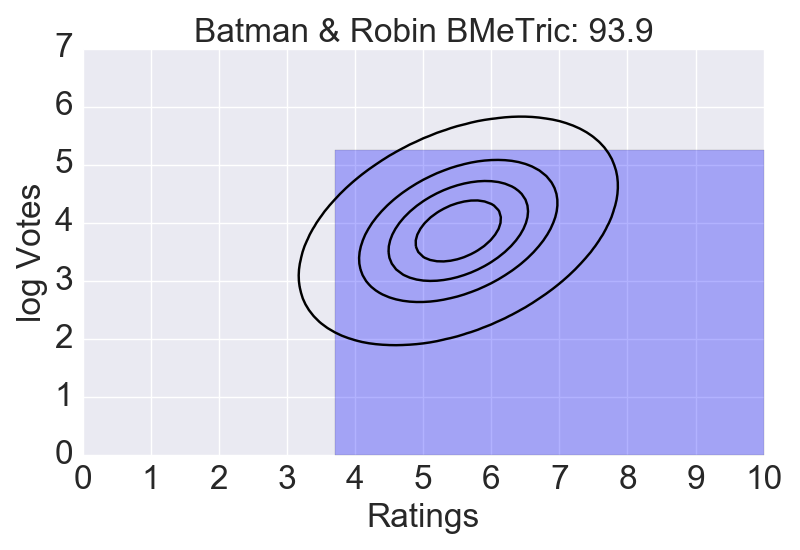
The BMeTric is then just a calculated cumulative distribution value given the number of votes a movie has and its rating. In other words, the BMeTric is just a theoretical percentage of movies that have a lower number of votes and a higher rating. For example, obtaining the nearest valid rating/vote combination for the peak of the normal distribution the BMeTric represents the shaded region:

Since there is relatively little correlation between the number of votes a movie gets and its rating, the BMeTric for a point near the peak is just about 25 (i.e. a quarter of the movies have a higher rating and lower number of votes). And for something like Batman & Robin (the worst-popular movie ever made according to the BMeTric) you’ll get a gaudy rating with this shaded region:
And that’s it. It is really that simple. We like the rating because it is unbiased (not trained), easy to calculate, and has a simple intuitive meaning. Plus it works out pretty well. Just look at all the crap movies in the bottom twenty!:
- 93.9: Batman & Robin (BMT)
- 91.6: Epic Movie (BMT)
- 91.4: Meet the Spartans (BMT)
- 90.5: Catwoman (BMT)
- 90.1: Justin Bieber: Never Say Never
- 90.0: Disaster Movie
- 88.6: Battlefield Earth (BMT)
- 86.6: Gunday
- 86.4: Dragonball: Evolution (BMT)
- 86.4: Jack and Jill (BMT)
- 85.4: Date Movie
- 85.4: Speed 2: Cruise Control
- 84.7: The Last Airbender (BMT)
- 83.9: Street Fighter
- 83.8: Scary Movie 5 (BMT)
- 82.6: Fantastic Four (2014) (BMT)
- 82.5: Ghost Rider: Spirit of Vengeance (BMT)
- 82.3: Norbit (BMT)
- 82.2: Son of the Mask
- 81.7: Movie 43 (BMT)
Only Justin Bieber: Never Say Never (which is just people being idiots) and Gunday (see that story here) are definitely fake. We marked out the ones we’ve seen so far. Pretty much just have Friedberg & Seltzer and Son of Mask as far as real movies go.
The BMeTric also gives us pretty good cutoff spots. In particular the 25th percentile is about 10, the 50th percentile is about 25, and the 90th percentile is about 50. There are about 50 movies a year with BMeTrics above 25, and around 10 movies a year with BMeTrics above 50. It all works out rather well, with basically a full crop of BMT films (52) being entirely filled by a natural “above-average” BMeTric cutoff, with room to “dip” all the way down to around 10 if we need to. It pleases us. We’ll leave it at that.
Bam. Here’s how we see the pros and cons of the BMeTric:
Pros:
– The BMeTric is completely impartial and unsupervised. No training data.
– It has an intuitive meaning: the BMeTric is (related to) the percentage of movies with a higher rating and lower number of votes.
– It is very fast to calculate, with all 10K movies from OMDb API being almost instantaneously calculated.
Cons
– It is ever changing. As the current movie vote/rating data changes so does the baseline. And as a movie’s vote/rating changes its BMeTric changes.
– Getting temporal data is nearly impossible since there is no historical record of mean, variance and co-variance for IMDB ratings and votes.
– It only generally relates to our tastes because it is unsupervised, and the BMeTric is hard to adapt into a supervised alternative.
Come back in a few years and BMT Labs might just have something more sophisticated to show you. For now, it is what it is. And yes, we will continue to put it in all of our previews and recaps.
